![]() BACK TO ourHealdsburg.com
BACK TO ourHealdsburg.com
![]() BACK to NOISE page
BACK to NOISE page
Developing a new Healdsburg Noise Ordinance
![]()
Noise Map Samples
![]()
Cities can develop a noise map of their community.
This map is for Birmingham, England and shows combined road and rail daytime sound levels in different colors. Click on the image for a large
picture. This type of map is useful for monitoring ambient noise, and
establishing baseline sound levels when overlaid with city zoning maps. Does
Healdsburg need such a map? Ideally an annual survey would provide
useful information about noise control regulations and give advanced warning
for potential future problem areas within the city.
daytime sound levels in different colors. Click on the image for a large
picture. This type of map is useful for monitoring ambient noise, and
establishing baseline sound levels when overlaid with city zoning maps. Does
Healdsburg need such a map? Ideally an annual survey would provide
useful information about noise control regulations and give advanced warning
for potential future problem areas within the city.
Very sophisticated noise maps can be made for monitoring and enforcement uses. The Geneva, Switzerland noise registry map is particularly good, allowing zooming capabilities to the city block level.
The map below shows how a noise map graphically illustrates the interaction of noise and physical barriers. This map shows an amusement park, in plan and in cross section.
Cross Sectional Noise Map In 1996 Navcon Engineers conducted a Noise Survey for a Amusement Park. The Cross Sectional Noise Map shows the propagation effects in the vertical plane [i.e. effect of distance, barriers and buildings]. The graphic adds another dimension of information to explain the interaction of multiple propagation parameters.
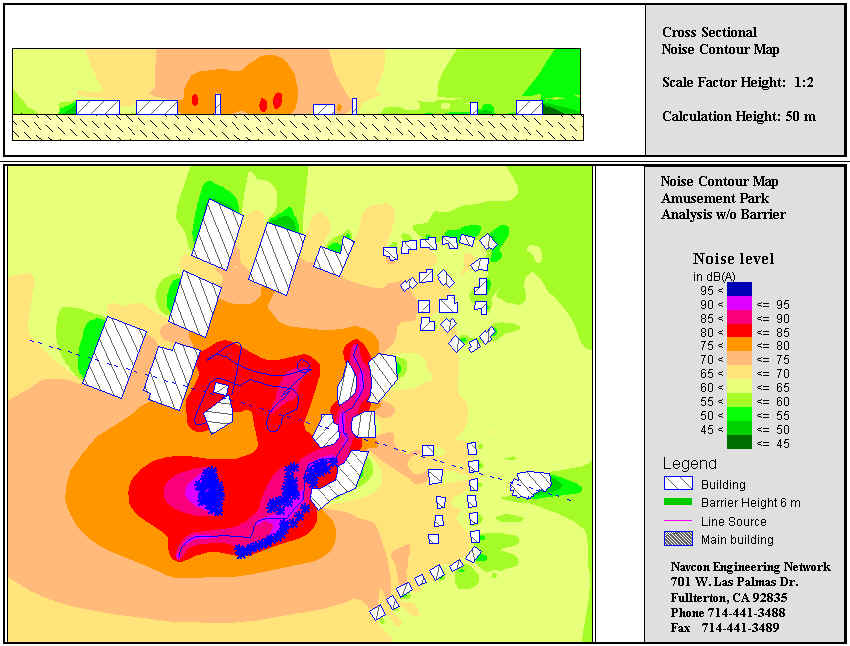
The figure above shows: Black lines: Ground, Blue Boxes: Buildings.
Colors indicated the Sound Pressure Level [High Noise level : red / blue color Low Noise levels : yellow / green colors].
The data for the cross sectional map was computed every 6 ft to a maximum height of 150 ft. above the ground. The height is scaled 1:2 to the scale of the plan view.
Send
mail to sales@navcon.com with
questions or comments about these noise maps. Copyright © 1997-2002 Navcon
Engineering Network.
![]()
![]()
![]() BACK TO ourHealdsburg.com
BACK TO ourHealdsburg.com ![]() BACK to NOISE page
BACK to NOISE page
webmaster:
![]() thomasjoad@ourHealdsburg.com
thomasjoad@ourHealdsburg.com
© 2002 ourHealdsburg.com™. All rights reserved.